World Vision Canada
Designing a personalized impact platform for donors
When people donate to a charity, it can be difficult to see what their individual contribution actually made possible. Annual reports and marketing updates tell the broader story, but rarely connect that impact back to the individual donor.
At World Vision Canada, we saw an opportunity to change that by creating a personalized member experience built around the impact of someone's giving.
As lead designer, I helped shape the product strategy and led the design of the new experience, including the impact dashboard, child sponsorship journey, and story feed.
Role
Lead Product Designer
Focus
Product strategy, information architecture
Users
~21,000 donors and child sponsors
Collaborators
Product, engineering, fundraising teams, World Vision International


Product Tension
Making donor impact easier to see
Before the new platform, supporters received updates through annual reports, marketing emails, mailed child updates, and occasional letters.
These communications were meaningful, but often infrequent and disconnected from an individual's giving.
Through research and supporter feedback, we heard a consistent desire for more frequent updates, richer stories, and clearer evidence that contributions were making a difference.
At the same time, World Vision was building the data infrastructure needed to connect donations with program outcomes. That created an opportunity to make impact much more personal.

Product architecture diagram
Design Strategy
Balancing the head and the heart
As we explored the experience, an important tension emerged. Some donors wanted evidence. They looked for measurable outcomes, accountability, and a clearer understanding of where their money went.
Others connected more strongly through stories, photos, videos, and updates from their sponsored child. Both were important. The challenge was finding a way for data and storytelling to work together without one overwhelming the other.
Design Strategy
Separate the experiences, connect the narrative
Our first version brought impact metrics, stories, and updates together on a single page. It was comprehensive, but it was also dense and difficult to navigate.
I separated the experience into two complementary areas.
The Impact Dashboard focuses on measurable outcomes across the programs a donor supports.
The Story Feed and Child Journey focus on the people and communities behind that impact through stories, photos, videos, and updates.
This gave each type of content more room to work while still connecting them as part of the same story.

Product architecture diagram
Key Experience Design
Making impact measurable
The impact dashboard gives supporters a clearer view of what their contributions help make possible.
I worked closely with product teams and stakeholders to determine which metrics were meaningful enough to show without overwhelming people with program data.
The experience brings together community outcomes, program participation, and impact across the regions a donor supports.
It also introduces broader global impact data, helping supporters understand how their individual giving contributes to something larger.
Key Experience Design
Making sponsorship feel more personal
For child sponsors, we designed a timeline that brings the sponsorship relationship together in one place.
Letters, photos, videos, community updates, and program milestones build over time, creating an ongoing record of the child's journey rather than a series of disconnected updates.
Within that experience, we also introduced small data points and a deeper progress view for supporters who wanted to understand the measurable outcomes behind the stories.
This allowed the human and quantitative sides of impact to reinforce each other rather than compete for attention.
Key Experience Design
Combining Stories with Data
Within the timeline, I introduced small data snippets that allow donors seeking more quantitative proof to explore deeper program outcomes through a progress tab.
This approach allowed storytelling and measurable impact to coexist within the same experience.
Constraints
Designing within a federated system
Making the experience feel simple required working through a much more complicated system behind it.
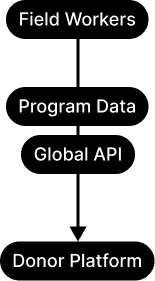
World Vision operates across field offices around the world, with program data, stories, photos, and child updates moving through systems managed by World Vision International before reaching World Vision Canada.
The experience needed to bring together quantitative program data, qualitative updates, and information from multiple internal APIs, often with different levels of completeness and consistency.
A significant part of the design work was figuring out how to create a coherent donor experience despite that complexity.
Product architecture diagram
Outcome
A more engaging donor experience
The new experience launched in beta and has since replaced World Vision Canada's legacy member site. Within its first year, monthly unique visitors grew from around 100 at launch to more than 22,000 at peak, with 15,000 to 22,000 monthly unique visitors sustained between February and June 2026.
Repeat visitors grew to roughly 22% of monthly unique visitors, suggesting supporters were returning to the platform rather than treating it only as an account servicing destination. The experience also became a meaningful giving channel. Supporters completed more than 11,000 donation checkouts and contributed over $1.5 million through the authenticated platform between September 2025 and September 2026.
Feedback has been particularly positive from child sponsors, who value having more frequent and personalized updates in one place.
Reflection
This project reinforced that showing impact isn't just a data problem or a storytelling problem. It requires both. Data provides evidence that something is changing. Stories help people understand what that change means.
Bringing the two together helped us create an experience where supporters could see not only that their contributions mattered, but how they were connected to the work happening around the world.
© 2026 Nelson Leung in Canada.